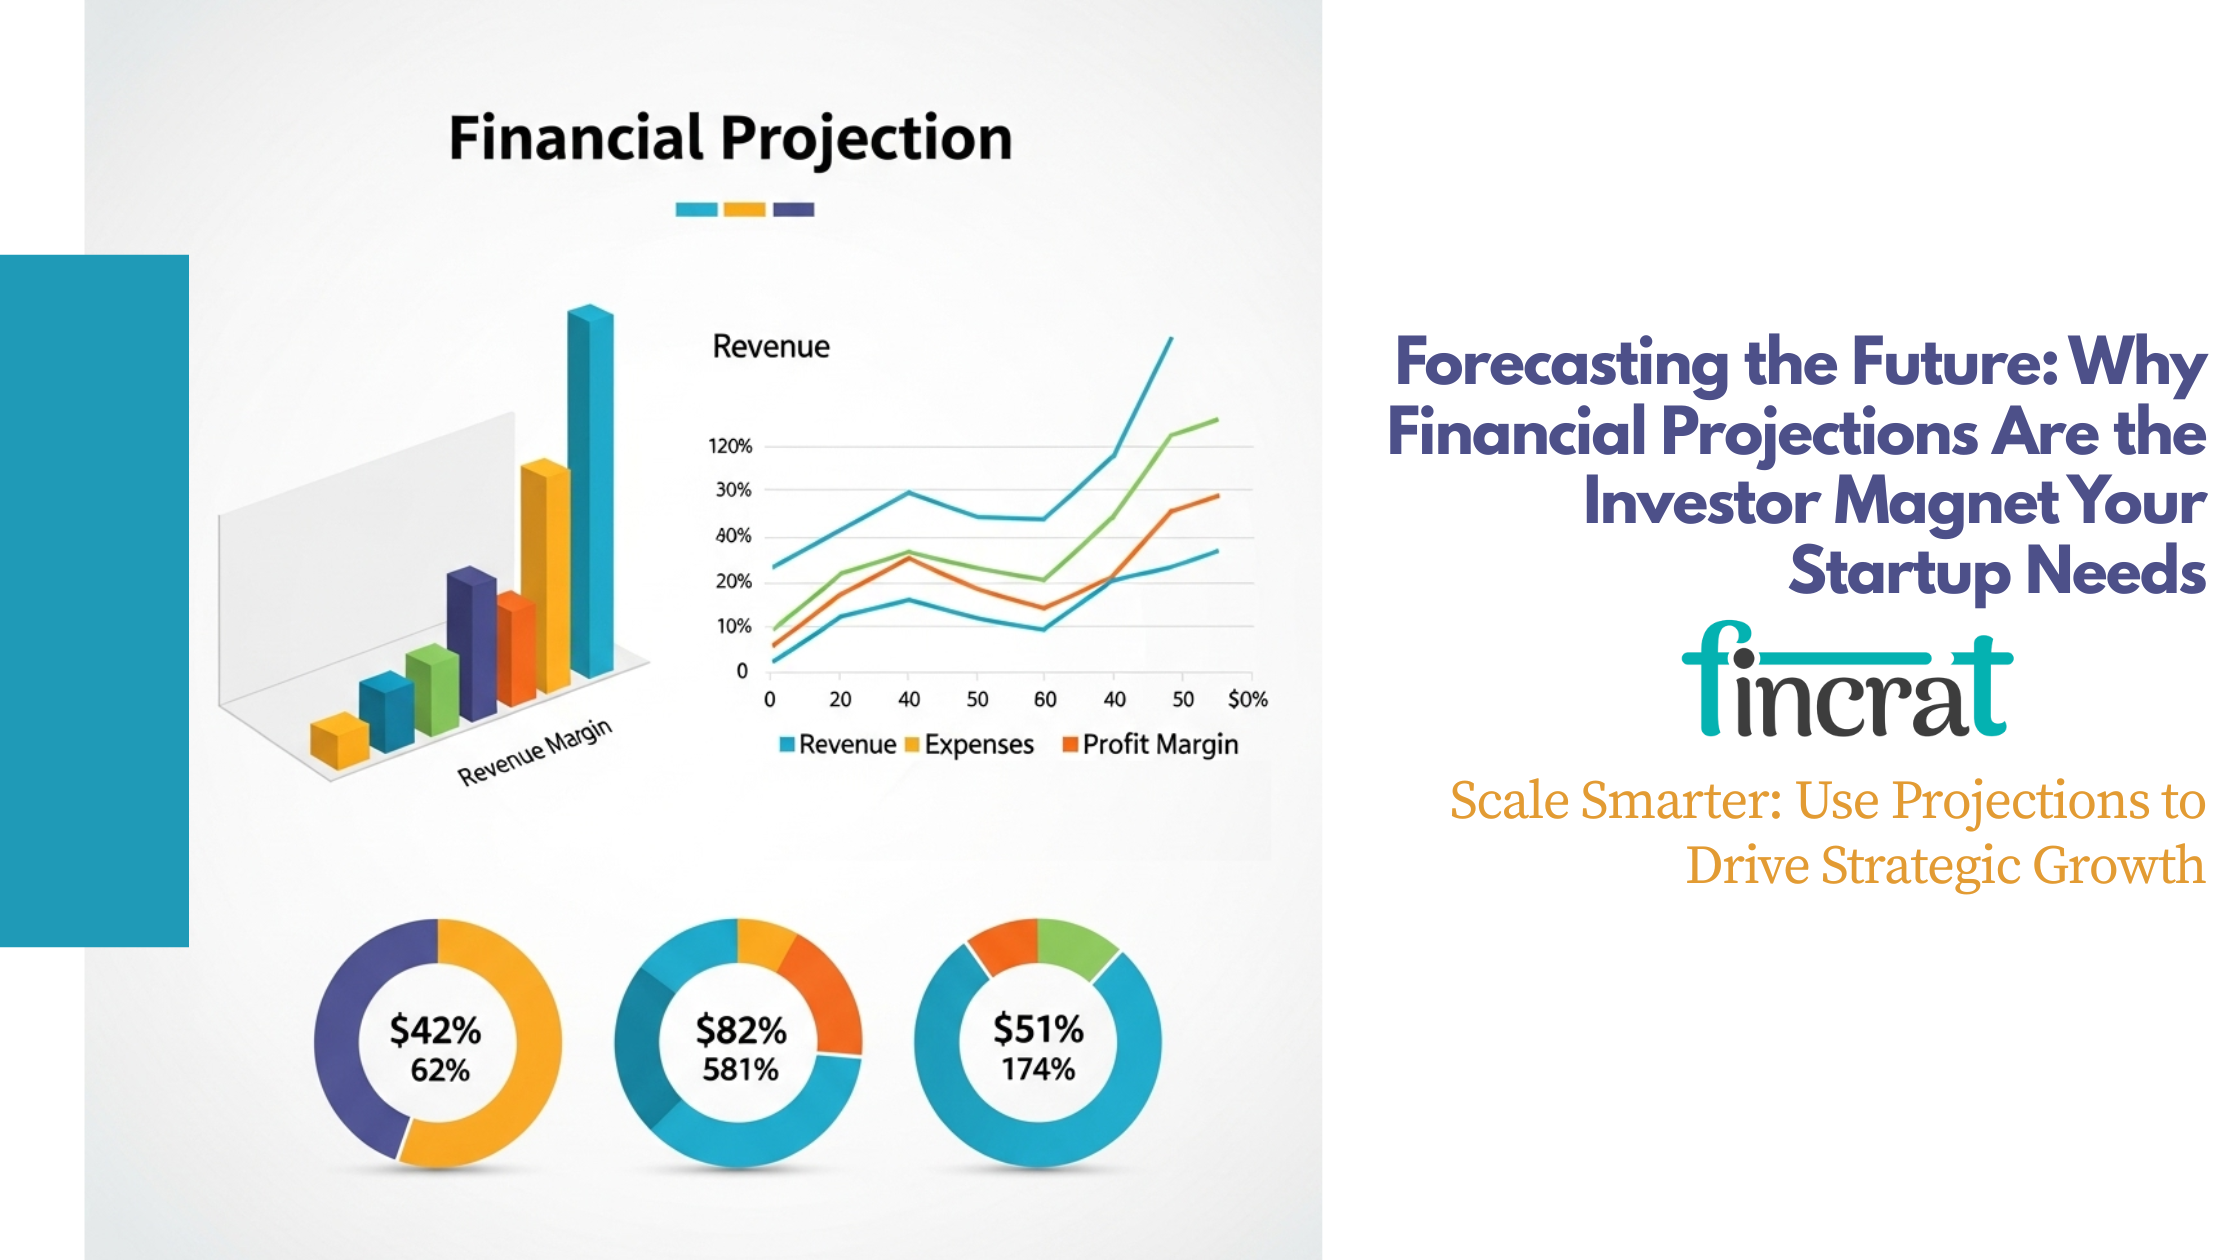
Forecasting the Future: Why Financial Projections Are the Investor Magnet Your Startup Needs
Scale Smarter: Use Projections to Drive Strategic Growth
In the fast-paced world of startups, passion, vision, and a disruptive idea will only take you so far. The real test comes when you pitch your dream to investors—and they ask the one question that separates aspirational thinking from fundable business:
“What do your financial projections look like?”
Financial projections are not just spreadsheets filled with numbers. They’re a strategic narrative—a data-driven vision of your future that speaks directly to investor logic, confidence, and risk appetite. Done right, they’re one of the most powerful tools for unlocking capital.
In this blog, we’ll dive deep into why financial projections are a non-negotiable part of your pitch, how to create compelling forecasts, what investors look for, and the mistakes that can ruin your credibility.
What are Financial Projections ?
- Financial projection is a forecast of the future financial performance of a company based on historical, market-based trends, and assumptions.
- Financial projections are prospective estimates of your startup's future financial performance.
- They are usually 3–5 years and are displayed in the form of projected income statements, cash flow statements, and balance sheets.
- These figures align with the amount you intend to earn, how much you will be spending, and how quickly you will grow, and how sustainable your business will be in the long term.
- They are not merely figures; they are a story of the way your business grows from an idea to a working product that can scale and be profitable.
- They act as a guide that describes how a company anticipates growing, working, and becoming profitable in the long term.
- In startups, financial projections are an essential element of a pitch deck and give investors a glimpse of the company's potential and feasibility from a financial perspective.
Why Projections Matter to Investors ?
Financial projections are essential in a pitch deck and business planning because they provide a clear, data-backed narrative of how your startup will grow, generate revenue, manage expenses, and become profitable.
Investors, stakeholders, and internal teams rely on these projections to assess viability, guide decision-making, and plan for future success.
1. Establishes Investor Confidence
- Forecasts indicate investors that you have an idea about your business model, industry trends, and expansion possibilities.
- Highly researched, realistic figures reflect expertise and professionalism.
2. Directs Financing Requirements
- Financial forecasts assist in determining the quantity of funds required, the reasons for the need, and for how long it will take.
- This enables a more influential and accurate funding assignment
3. Determines Strategic Choices
- Your forecasted revenue, expenses, and margins inform pricing planning, hiring, marketing, growth, and capital deployment.
- It makes decisions financially feasible.
4. Uncovers Business Viability
- Projections show when and how your business will break even and whether the business model is scalable and sustainable in the long term.
5. Assists with Tracking Performance Over Time
- Financial forecasts become your internal standards.
- Once your business expands, you can measure actual performance against forecasts to fine-tune approaches and enhance forecasting reliability.
6. Facilitates Valuation & Negotiation
- Projections impact the way investors evaluate your firm's worth.
- Strong but realistic projections can result in a solid valuation in funding negotiations
Purpose of Financial Projections
1. Strategic Decision-Making
- Financial projections help founders make informed decisions about pricing, hiring, product development, marketing, and scaling.
- They provide clarity on how strategic choices affect the bottom line.
2. Determining Funding Requirements
- Projections show how much capital the startup needs to operate and grow.
- They outline when you’ll need funding, how it will be used, and how long it will last (your “runway”).
3. Measuring Financial Health
- They offer a baseline for measuring progress. Comparing real performance to predictions lets you see the strengths, weaknesses, and course corrections needed.
4. Showcasing Business Viability
- Projections show that your business can ultimately turn a profit and stand on its own.
- This puts investors and partners at ease knowing that your model has potential for scalability and financial sustainability.
5. Presenting Growth Potential to Investors
- Projections are necessary in your pitch deck to be able to articulate how large the opportunity is, how quickly you can scale .
- what types of returns investors can expect.
What Do Great Financial Projections Include?
Financial projections are made up of several financial statements and performance metrics. Each component serves a unique role in showing the current assumptions, future goals, and expected financial trajectory of your startup.
1. Revenue Projection
- Revenue projection is a projecting statement that estimates the amount of income that a business anticipates to earn within a given timeframe based on prices, customer acquisition levels, and market size.
- It captures the company's growth expectations and monetization strategy.
- An approximation of the income your startup can anticipate earning in the course of time, typically segmented monthly or annually for 3–5 years.
- Indicates the magnitude of your opportunity.
- Shows how you intend to generate revenue.
- Illustrates growth projections and price reasoning.
- Sales quantity (units/users/customers)
- Price plan (e.g., one-off, subscription)
- Growth assumptions (e.g., 10% MoM growth)
- 60% - 70% of startups overestimate their first 3 years revenue.
- SaaS firms will usually grow revenue at 20–40% per annum if scaling.
- Example: A SaaS venture investment forecasting 500 users in Year 1 each at $30/month = $180,000 revenue.
2. Cost of Goods Sold (COGS)
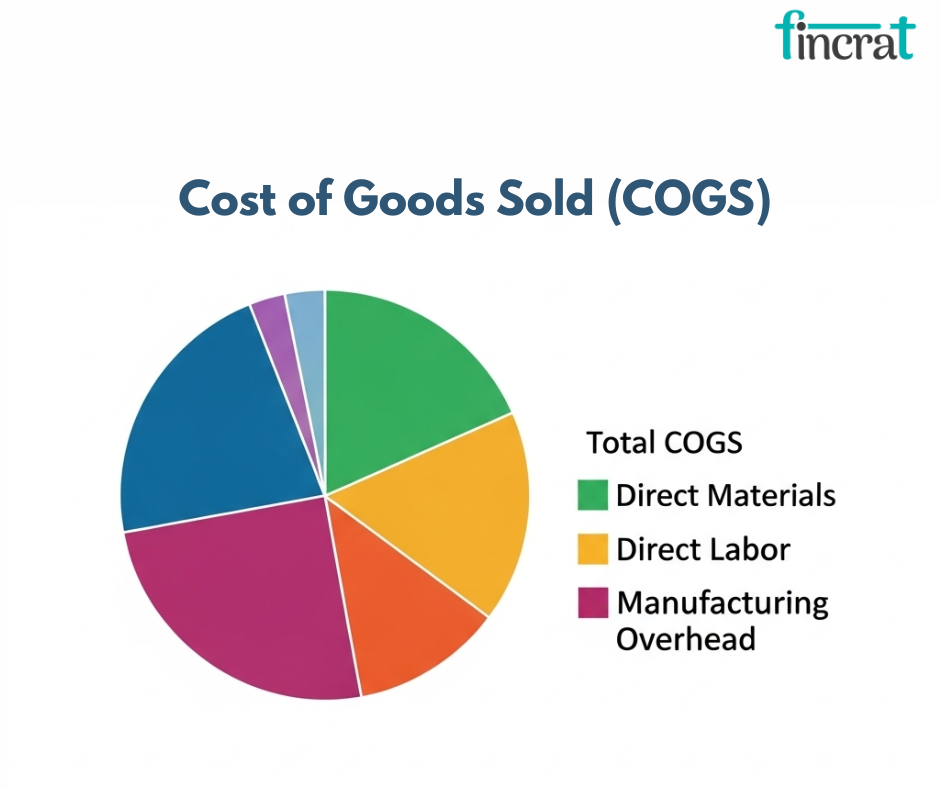
- COGS is the direct costs of goods production or service delivery sold by a business.
- This encompasses material costs, production labor, and any other cost directly related to revenue generation.
- Direct costs of making and delivering your product or service.
- For software startups, COGS is as low as 10–20% of revenue.
- For physical product startups, COGS can be as high as 60% of revenue.
- Used to determine gross profit.
- Aids in determining operational efficiency and profitability.
- Manufacturing expenses
- Hosting and software infrastructure (for technology firms)
- Shipping, packaging, raw materials
- Freelance or contractor fees associated with delivery
- Example:If your online product retails for $50 and costs $20 to manufacture, your COGS is $20/unit.
3. Operating Expenses (OPEX)
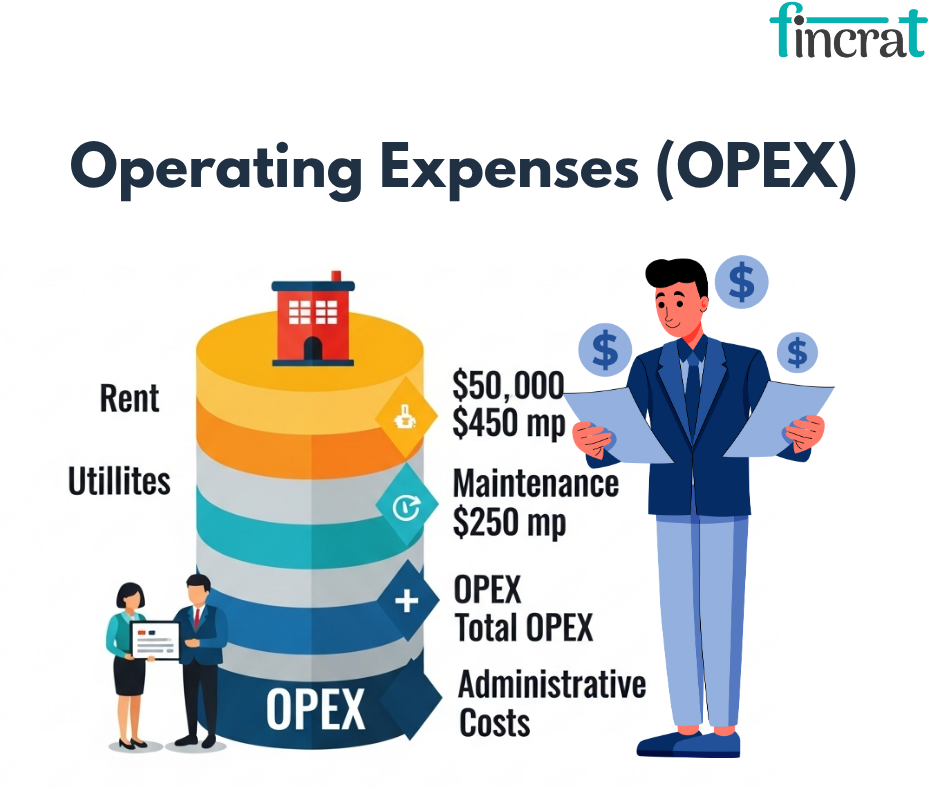
- Operating expenses are indirect costs to operate a business on a daily basis, aside from costs related to production.
- These are wages, rent, utilities, advertising, administrative costs, and technology infrastructure.
- Indirect costs needed to operate your business that do not relate to production.
- Critical in the determination of net income and cash requirements.
- Identifies where resources are being spent.
Types:
- Salaries and wages
- Advertising and marketing
- Rent and stationery
- Software, equipment, utilities
- Legal and administration costs
- Advertising and wages are the two biggest components of OPEX in early-stage ventures.
- Startups must try to maintain lean fixed OPEX for the first 18–24 months.
- Example:A startup with 3 staff, $5,000/month marketing expense, and $2,000 office rent will have high monthly OPEX.
4. Gross Profit and Gross Margin
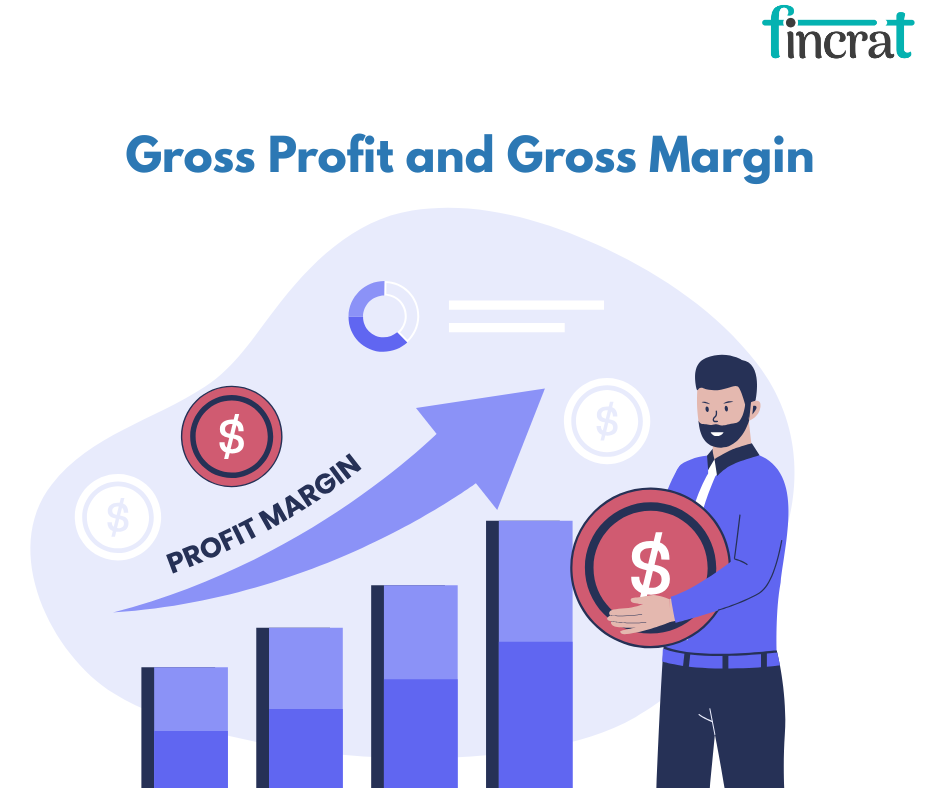
- Gross profit is a difference between revenue and cost of goods sold.
- Gross margin is the amount of revenue above COGS and expresses how well a company makes products or delivers services.
- Gross Profit = Revenue – COGS
- Gross Margin = (Gross Profit ÷ Revenue) × 100%
- Tracks how much money you take home after direct costs.
- Scalability and good business economics are reflected in higher margins.
- SaaS startups target a gross margin of more than60%- 70%.
- E-commerce startups tend to have 30–50% gross margins, for example:
- Revenue = $100,000, COGS = $40,000 → Gross Profit = $60,000 → Gross Margin = 60%.
5. EBITDA (Earnings Before Interest, Taxes, Depreciation, and Amortization)
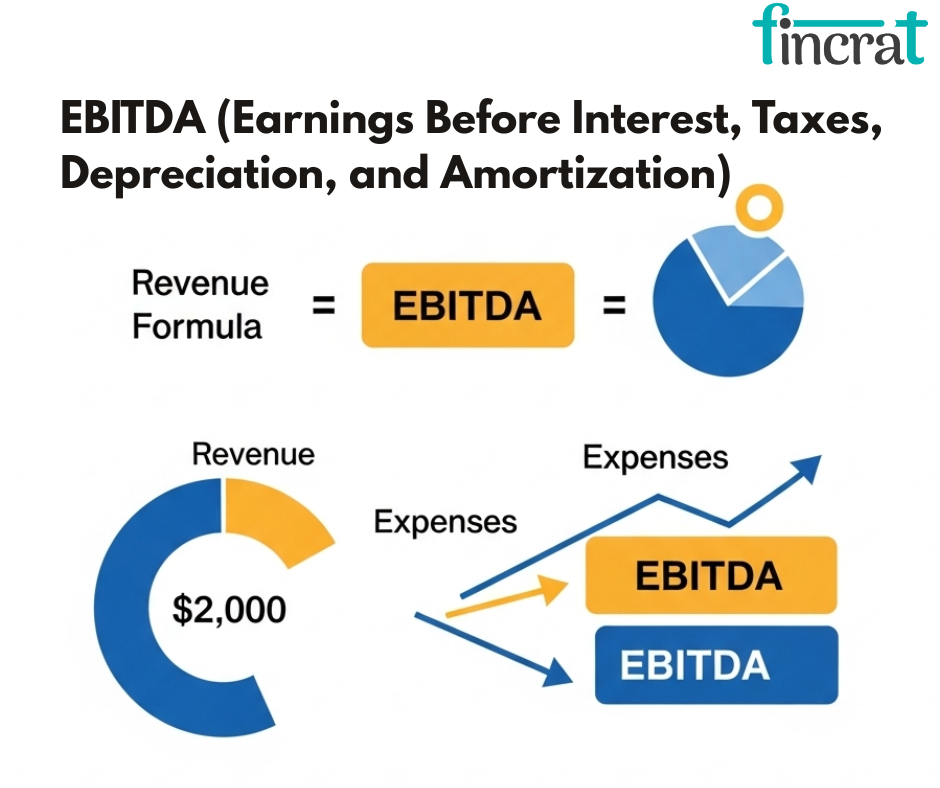
- EBITDA is an accounting measure that measures the core operating performance of a company by removing the influence of financing, accounting decisions, and tax climates.
- It gives a purer picture of profitability and is commonly used for comparing efficiency of operations.
- An important measure of profitability reflecting core business performance prior to financial realignments.
- Commonly employed by investors to benchmark performance between companies and industries.
- Removes accounting distortions.
- Formula:
- EBITDA = Revenue – COGS – OPEX
- VCs typically employ EBITDA as a measure of valuation, particularly for later-stage startups.
- A positive EBITDA is usually demanded prior to Series B and later.
- Example: Revenue = $500K, COGS = $200K, OPEX = $200K → EBITDA = $100K
6. Cash Flow Projections
- Cash flow projections project the inflow and outflow of cash over time, a measure of a company's ability to pay bills, invest in growth, and stay solvent.
- It emphasizes liquidity and financial viability.
- Forecasts actual cash inflows and outflows in your business in the future.
- Assists in monitoring liquidity.
- Indicates when you will be out of cash.
- Assists in calculating burn rate and runway.
- Operating Activities (cash from underlying business)
- Investing Activities (purchasing assets, etc.)
- Financing Activities (borrowing, investor funding)
- 80%- 82% of small businesses go out of business due to mismanagement of cash flow.
- Venture-backed start-ups usually burn $50K–$500K/month, stage-dependent.
- Example: Spend $25K/month with $150K in the bank = 6-month runway.
7. Profit & Loss Statement (P&L)
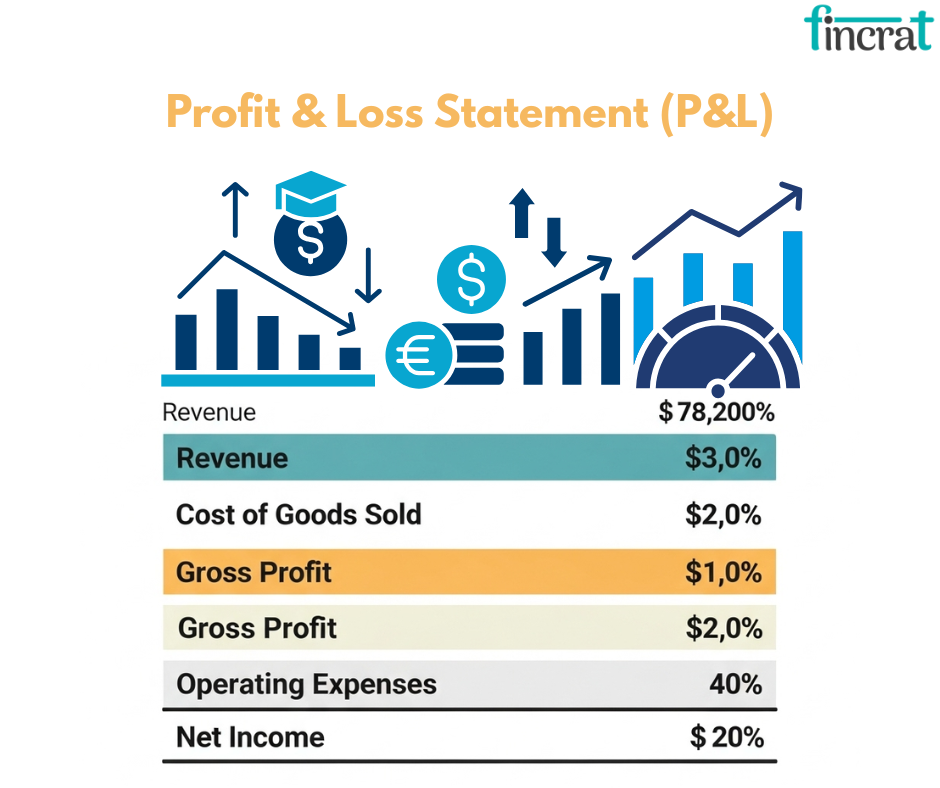
- The P&L statement, also known as the income statement, reconciles a business's revenues, costs, and expenses over an interval.
- It indicates whether a business is in profit or loss and is crucial in determining performance and viability.
- Reconciles revenue, cost, and expense during a given time period to illustrate net profit or loss.
- Demonstrates a bird's-eye view of profitability in business.
- Usually the key document in a pitch deck's financial slide.
- Profits and loss statement usually Includes:
- Revenue
- COGS
- Gross profit
- OPEX
- EBITDA
- Net profit
- The majority of investors ask for a 3–5 year P&L in a pitch deck.
- Precise P&L statements save 70%- 80% of startup budget mistakes.
- Example: During Q4 2024, Startup Co. recorded $100,000 in revenue. Subtracting $30,000 in cost of goods sold and $50,000 in operating expenses, the company registered a net profit of $20,000, indicating positive performance in the quarter.
8. Projected Balance Sheet
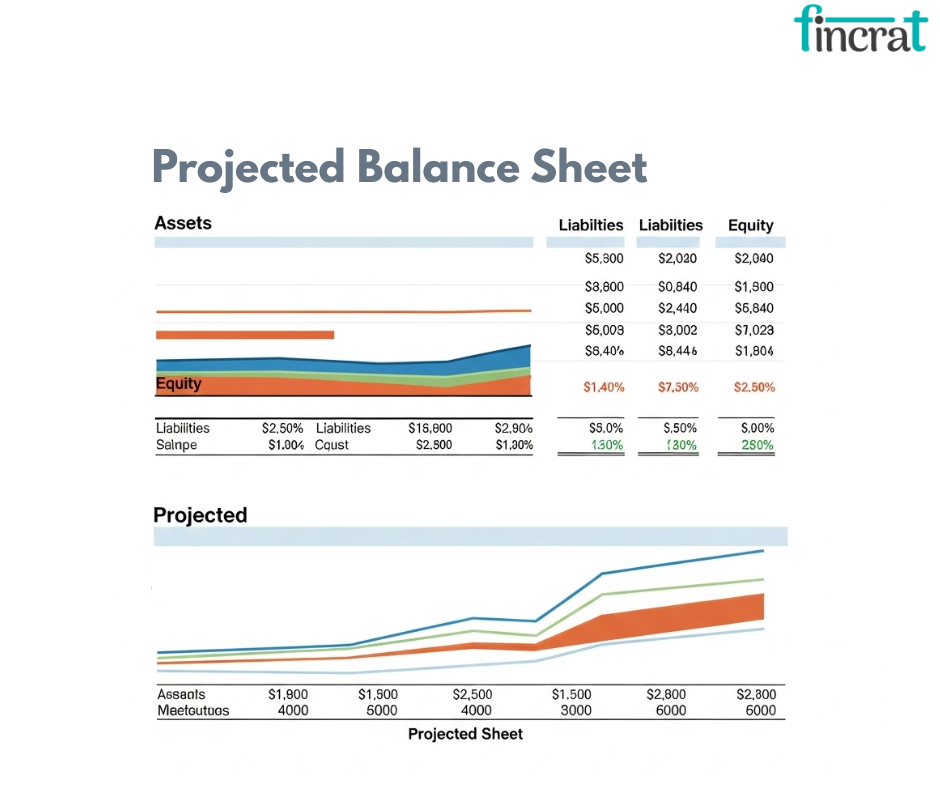
- A balance sheet is an account of a company's position at a specific point in time, including its assets, liabilities, and shareholders' equity.
- It shows the company's net worth and financial structure.
- A snapshot of what your business owns (assets), owes (liabilities), and what's left over (equity).
- Illustrates long-term financial health.
- Investors rely on it to determine debt levels, asset utilization, and equity ownership.
- Includes:
- Assets: Cash, equipment, receivables
- Liabilities: Loans, accounts payable
- Equity: Founder equity, retained earnings
- Startups with a 2:1 asset-to-liability ratio are financially healthy.
- Balance sheets are vital during investment due diligence.
- Example: Startup Co.'s balance sheet is $155,000 assets, $70,000 liabilities, and $85,000 equity—reflecting that the company's finances are balanced and healthy.
9. Break-Even Analysis
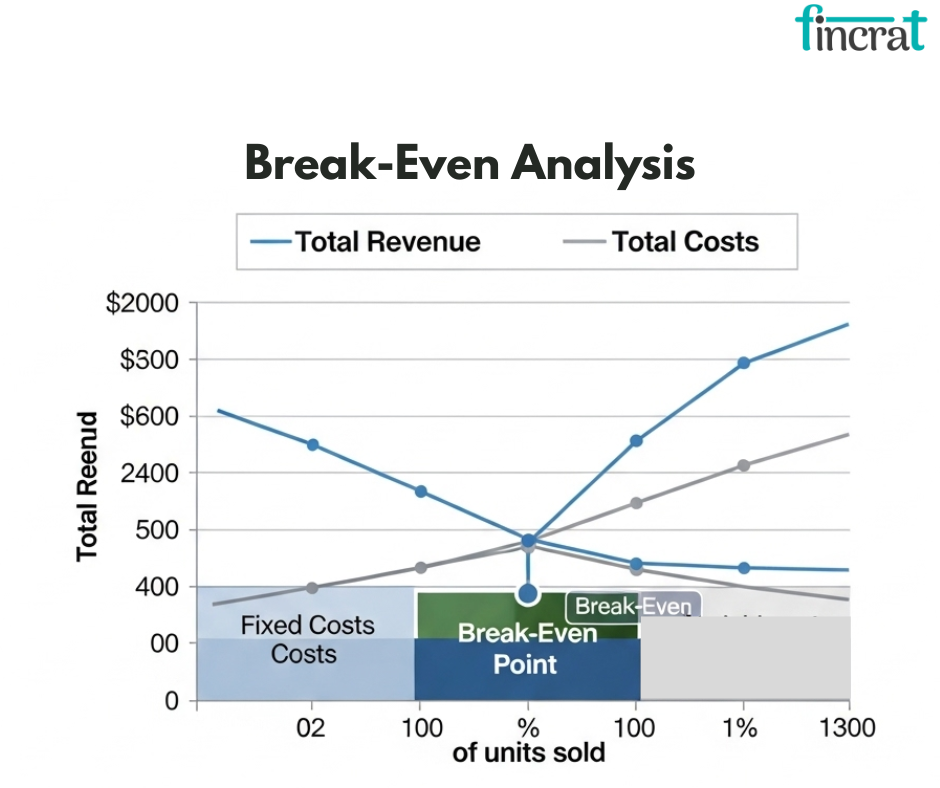
- Break-even analysis calculates at what point total revenue equals total costs, i.e., the business makes neither a profit nor a loss.
- Break-even helps determine the minimum performance needed to continue operations.
- The point where your revenue is equivalent to your total fixed and variable costs.
- Assists in determining how long it will take before you're profitable.
- Investors are interested in your break-even period.
- Investors are interested in your break-even in 18–36 months.
- The sooner you break even, the more financially appealing your startup is.
- Formula:
- Break-even = Fixed Costs ÷ (Unit Selling Price – Variable Cost per Unit)
- Example: $100,000 fixed costs ÷ ($25 – $10 per unit) = 6,667 units to break even.
10. Unit Economics
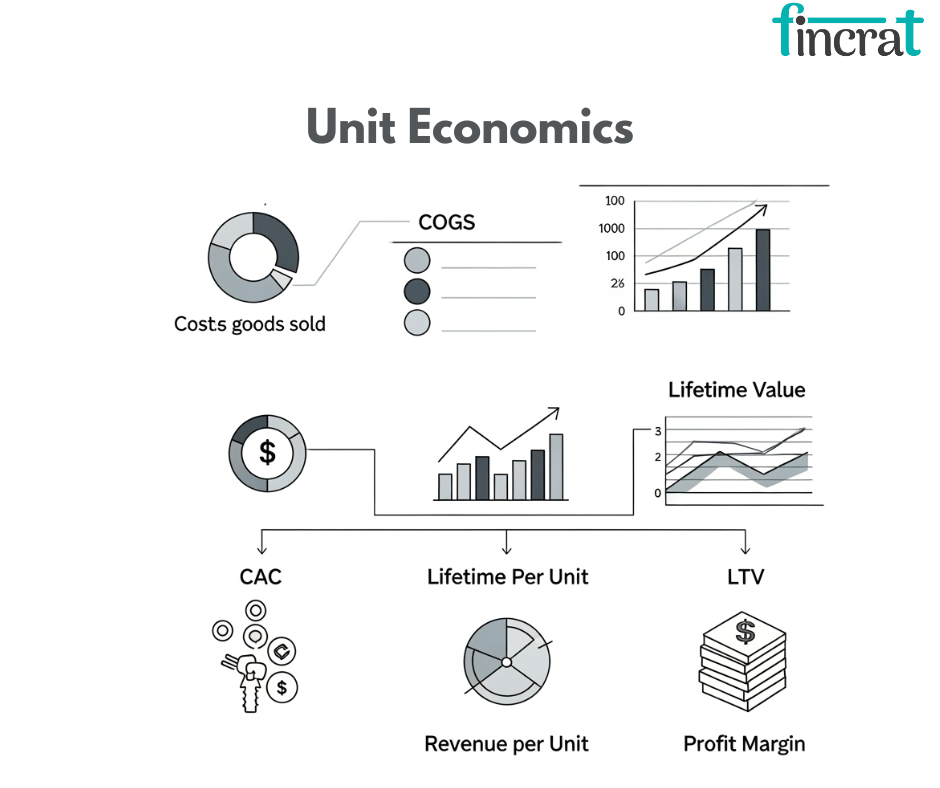
- Unit economics is the direct cost and revenues related to a single unit of customer or product.
- It is applied to evaluate profitability on a micro level, which is usually calculated by metrics such as Customer Acquisition Cost (CAC) and Customer Lifetime Value (LTV).
- Evaluates the value and cost of acquiring and serving a single customer.
- Used to determine scalability.
- Applied to validate marketing expenses and revenue potential.
- CAC (Customer Acquisition Cost): The amount you invest to gain a customer.
- LTV (Customer Lifetime Value): The revenue you project from a customer over the long term.
- LTV:CAC Ratio: Should be 3:1 or higher.
- The ideal ratio of LTV:CAC is 3:1 or better.
- A payback period for CAC of less than 12 months is healthy in most businesses
- Example: CAC = $50, LTV = $200 → LTV:CAC = 4:1 = healthy.
Types of Financial Projections
Financial projections are categorized based on the timeframe they cover. Each type of projection serves a specific purpose and helps a business plan, manage, and track its financial performance over time. Here's a detailed look at the different types of financial projections:
1. Short-Term Projections (1 Year)
- Short-term financial projections are forecasts for the immediate future, typically up to a year ahead, and are employed mainly for planning and controlling the business's day-to-day activities.
- These are normally highly detailed, including monthly or quarterly financial data, and reflect the company's immediate financial requirements.
- Short-term forecasts make businesses responsive and nimble.
- They cover operational expenditures and leave the company with funds necessary for day-to-day operations.
- Short-term is an important phase for startups to get settled and pick up speed.
- Day-to-Day Management: Assists a company in managing its cash flow, operational expenditures, and short-term financial obligations like wages, rent, and payments to suppliers.
- Funding Needs: Gives an overview of the money needed in the upcoming year, such as working capital and how much money might be necessary to ensure the company continues operating effectively.
- Budgeting and Cash Flow Strategy: Assists companies in managing resources efficiently and forecasting seasonal revenue or expense swings.
Major Components:
- Forecasting Revenue: Forecasting revenue on a monthly or quarterly basis based on sales patterns, marketing, or customer expansion.
- Expense Management: Budgeting for both fixed and variable expenses for operational costs such as wages, office space rental, utilities, advertising, and supplies.
- Cash Flow Analysis: Comprehending the inflow and outflow of cash to guarantee sufficient liquidity to pay bills.
- Break-even Analysis: Identifying the point at which total revenue equals total cost, assisting businesses to realize when they will be profitable.
- Example: A startup projects Q1 revenue of $50,000, with increases in customer base and volume of sales anticipated. They project their operating expenses (marketing, salaries, etc.) will be $35,000 every quarter, leaving them with $15,000 of net profit.
2. Mid-Term Projections (3–5 Years)
- Mid-term projections usually run for a 3 to 5 year horizon and are utilized to anticipate business growth and determine the performance of the company over a period of time.
- These projections are not as specific as short-term projections but are nonetheless indispensable for monitoring progress and planning scale-up.
- Mid-term projections serve to ensure that businesses are well-placed to handle growth.
- They give clarity on how resources will be deployed, whether external capital will be required, and how rapidly the company can ramp up operations efficiently.
- Business Growth Projections: Informally tells startups how their business will develop in the next several years. It forecasts key milestones like customer growth, product development, and geographic growth.
- Capital Requirements to Scale: Determines capital requirements to scale the business. It forecasts when the business will require extra capital or when the business will be self-sustaining.
- Market and Operating Strategy: Enables businesses to simulate the effect of changes in the market, price models, or product lines on overall profitability and viability.
Major Components:
- Revenue Projections: On the basis of anticipated market share, pricing strategies, customer acquisition rates, and industry trends. It is necessary to project how quickly the company is able to grow and how long-term this growth is.
- Operating Expenses: Projecting higher operating expenses as the business expands, such as salaries, marketing, customer service, and infrastructure.
- Profitability and Cash Flow: Predicting when the company becomes profitable, and an elaborate cash flow statement to confirm there is sufficient liquidity for growth efforts.
- Debt or Equity Financing: When there is a need for external finance for expansion, mid-term estimates assist in identifying when and how much will be needed, whether loans, equity partners, or venture capital.
- Example: A company expects revenue growth of 20% per annum for 3 years to a level of $1.5 million in Year 3. But it also projects its operating expenses increasing from $800,000 to $1.2 million as the firm scales up.
3. Long-Term Forecasts (5+ Years)
- Long-term financial forecasts gaze further into the future than the near and medium-term to forecast a business's finances for 5 or more years.
- These are more strategic and speculative, frequently employed for exit strategy, long-term planning, or comprehension of the business's potential within a wider market context.
- Strategic Planning: Long-term projections assist in determining the general direction of the company, growth path, and long-term sustainability. They are concerned with establishing overall objectives and mapping the journey to getting there.
- Exit Strategy Planning: These projections are crucial for founders and investors when considering exit alternatives (e.g., sale of the firm, merger, or initial public offering). They can also be employed in determining company valuation over time.
- Market Growth: Long-term forecasts assist in assessing how the business would do in new markets, such as international growth, expansion to new product lines, or engaging in large-scale diversification.
Major Components:
- Revenue Forecasts: Long-term forecasts typically forecast revenue from new market growth, new products, or higher customer retention. These forecasts are typically wider, depending on market conditions and growth potential.
- Capital and Investment Strategy: These estimates evaluate future rounds of funding, possible IPO plans, or debt offerings. The analysis considers how capital requirements will change as the business matures.
- Exit Valuation: Long-term projections incorporate an estimated exit valuation based on industry trends, company performance, and market conditions. This will assist in determining the firm's value for possible acquirers or public offerings.
Example of Financial Projections:
For a SaaS company projecting growth, they might forecast:
- Year 1: 500 customers, each paying $30/month, resulting in $180,000 in revenue.
- Year 2: Expecting a 30% increase in customers to 650, leading to $234,000 in revenue.
- Year 3: A further 30% increase in customers, reaching 845 customers and generating $304,200 in revenue.
In this projection, the company would also estimate its COGS, operating expenses, and expected profits over the three-year period.
Final Thoughts: Financial Projections Speak Louder Than Promises
Financial projections are more than just numbers on a spreadsheet—they’re your startup’s roadmap, credibility statement, and growth narrative wrapped into one. They give investors a clear picture of where you're headed, how quickly you can get there, what barriers lie in your path, and how much capital it will take to overcome them.
In a world where thousands of startups are vying for attention, your ability to quantify your vision sets you apart. A solid financial forecast doesn’t just build trust—it proves you’ve thought through every critical milestone, from burn rate to break-even point.
So, if you're serious about raising capital, remember this:
“Don’t just pitch the dream—project the journey. Investors don’t fund potential. They fund precision”.